Obtaining Demand Schedule:
To obtain the demand schedule the formula is,
Qdx = f(Px)
Considering, an individual demand function for a commodity X is given by,
Qdx =8 – Px cet.par.
Here, Qdx is the quantity demanded and Px is the price of X commodity.
Now substituting various prices of X in the above given equation to find out the demanded quantity for them. Finally we will obtain the demand schedule as following,
|
Px $
|
5
|
4
|
3
|
2
|
1
|
|
Qdx
|
1
|
2
|
3
|
4
|
5
|
|
Fig. : Demand Schedule
|
|||||
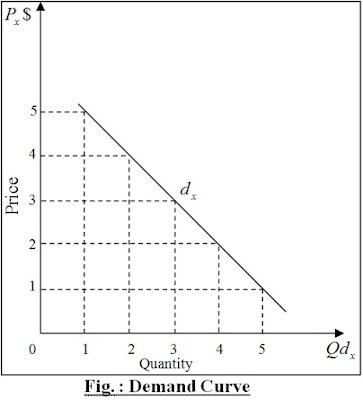
Now to obtain the demand curve, we will plot each pair of values from the demand schedule on a graph.
Obtaining The Demand Curve:
In that given graph figure, we have plotted all the pairs of value from the above given demand schedule. We have plotted various prices on the vertical axes and quantity demanded on the horizontal axes. dx is the required demand curve.
From that graph, it is seen to us that when the price is high, the quantity demanded is low. Again, when the price is low the demand is high. That is the price and demand has a inverse relation.
That can be indicated, such as, when the price is 5$ the demand is 1 unit, when the price is 4$ the demand is 2 unit etc. That’s how the demand increases with the decrease in price.
